How to Monitor Klever Node

In the previous article we discussed about how we set up Klever Node on testnet. Now let’s see how Trustednode keeps track of the node healthiness by setting up the monitoring tools.
Our monitoring setup has been summarized below:
Uptime Kuma
Uptime Kuma is a monitoring tool like “Uptime robot” with the function of checking website uptime. It displays a pretty status interface and provides notifications via different channels such as email, Slack and Telegram.
You can learn more details at https://github.com/louislam/uptime-kuma
Setup
Uptime kuma is based on docker. Please refer to the installation guide from docker official https://docs.docker.com/engine/install/
To run uptime kuma

Visit http://localhost:3001 when it is ready. You may need to set up your credentials. Once it is done, we can add a Klever endpoint to monitor its uptime.
Monitor Klever Uptime
Klever exposes several endpoints at port 8080 we can use to monitor its uptime.
- <IP>:8080/node/status
- <IP>:8080/node/metrics — can import to prometheus to track status
This time we will use “/node/status”
Add Klever Endpoint
To track a new endpoint, click Add New Monitor under the title
Fill in the details below
- Monitor Type — HTTP(s), You can also check by keywords
- Friendly Name — any name you like
- URL — http://<IP>:8080/node/status
- Heartbeat Interval — the interval you want the uptime kuma to call the website. I.e., 60 for accessing the page for every 60 seconds
- Retries — maximum number of retries when it fails to access the page
For the rest of the params, using the default settings is fine.
Once you’re done, click Save.
Setup the Status Page
Press the Status Page on the top-right corner
You can add a new status page, or use the default one. Click on anyone you like.
Then you should see the status page, click Edit Status Page.
After that, you can add the Klever endpoint by filling the Add a monitor field:
You can also add different groups if you want for better representation.
Zabbix
Besides Uptime kuma for monitoring service uptime, we also used Zabbix to monitor the infrastructure resources performance and utilization. Zabbix also provides different notification channels to notify host healthiness. You can set it up at your own preference.
Install Zabbix Host
To install Zabbix, you can refer to a comprehensive guide from computingforgeeks
https://computingforgeeks.com/how-to-install-zabbix-server-on-ubuntu/
Install Zabbix Agent
To install the agent, we need to add the zabbix agent repo to the Ubuntu repo
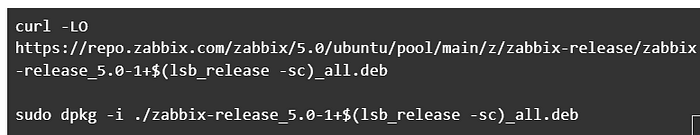
Then we can install it via apt

Once it is finished, we need to configure the agent to connect to the Zabbix Host.
Edit the configuration file.

Modify the following lines per your own configuration

You can also configure it to connect via HTTPs. For simplicity the guide is not covered.
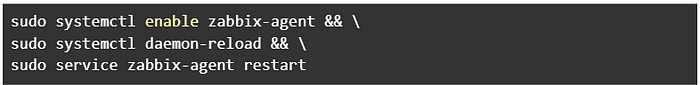
Lastly, we can enable the service. Make sure the port 10050 is opened to Zabbix Host on your firewall.
Go back to the Zabbix Portal, we can add our Klever host now.
Click Configuration > Hosts
Then you can clone or add a new host by filling in the fields below.
Make sure the Hostname aligns with the name you used in the zabbix agent configuration.
Also the IP address should be the Klever Host IP address.
Apply different templates set by your own preferences.
Once you add the host, you can go back to Monitoring > Hosts.
Choose for your Klever host and select Graph, you should get a similar graph like below.
After that, feel free to add the graph onto the dashboard for your own preference.